What are CATZOC and How to Use it for Passage Planning?
When I had just started my sea career, I never understood how the depths of the entire ocean was measured.
I mean 70% of the earth is covered with water. How was this nearly impossible task of measuring the depths achieved?
Over the years I realized that it was not done in few days and not by few men.
This task is ever going since hundreds of years and the hydrographic offices of the countries are conducting these surveys regularly.
The only thing that has changed over the years is the method of conducting these surveys.
In early days the survey was done with hand-lead lines and single beam echo sounders.
It then changed to the wire-drag method where a wire was dragged by two or more ships with weights submerged to the fixed depth.
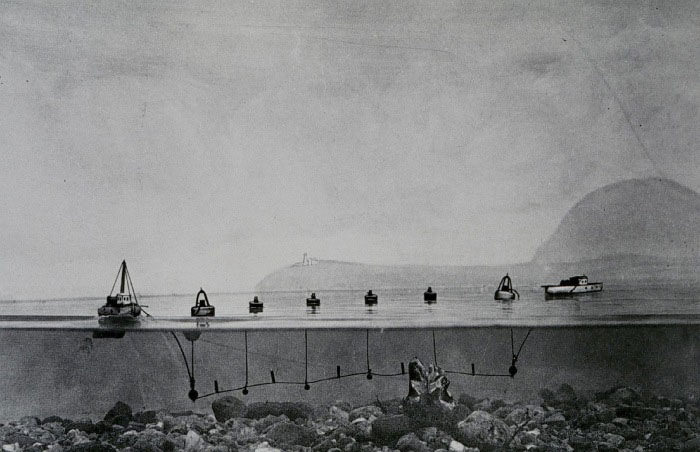
Any obstruction in the area covered would be detected by the wire getting stretched.
The modern technique uses SONAR multi-beam waves to record the depths. The collected data is processed through other data like tide to get the depth as accurate as possible.
This method, of course, would give more accurate depths.
So Let is say we both are on a vessel and we are reviewing our next passage plan. You being master of the vessel and me as 2nd mate.
I give a brief about the passage plan and point out to you that at one section of the plan, UKC for the ship will be 1.5 meters which is more than the minimum required by the company.
You are still worried and I cannot understand why?
I ask you, hey Cap, What are you worried about? Our UKC is complying with the company’s UKC Policy.
Your reply: What if the depth mentioned on the chart is not accurate?
We both dig a bit more and find that this depth was measured in the year 1920 by hand-lead line.
Will you change your passage plan or you will trust the depth?
Of course, you cannot trust this depth to be absolutely accurate.
But then me, you and everyone at sea would be interested in knowing the answer to this one question.
How much error can we expect?
This is what CatZoc is all about.
Let us discuss Catzoc in details.
Type of expected errors in depths
When a depth is measured during a survey, there can be two errors to this depth.
- Depth may not be accurate.
- The position at which this depth is marked may not be accurate
The latest survey conducted with the latest technology can be considered to have better accuracy.
What is CATZOC or Zone of confidence
If the possible errors in depth and position where depth is marked were constant on the charts, it would have been easier to just apply a constant error.
But these errors are not constant.
As the technology advanced, the errors in these readings became marginalized and readings taken were more accurate.
But how do we know which readings are accurate and which are not?
Also what maximum errors can be expected in these reading?
Information about CATZOC (or zone of confidence) helps in this.
Based upon the error in position and depth, the accuracy data is divided into 6 zones of confidence (CATZOC).
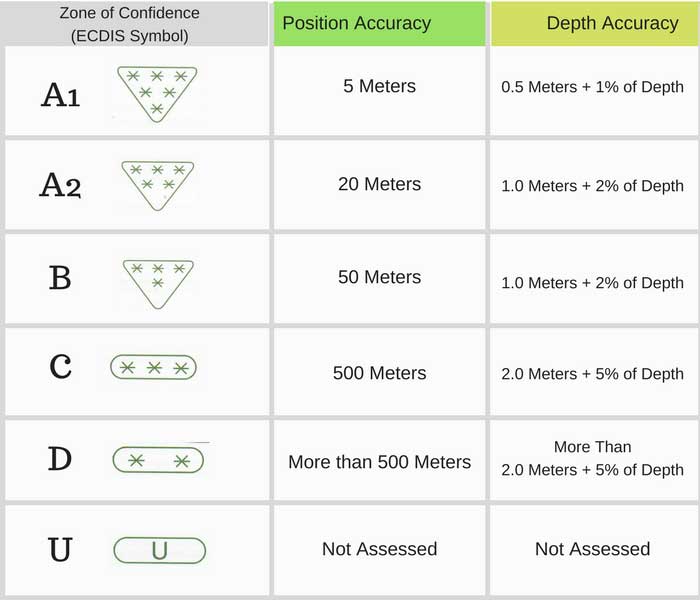
Each zone of confidence (CATZOC) has been assigned the maximum errors that it can have in depths and its positions marked on the charts.
So if for a chart or ENC, the CATZOC is 4 star (zone of confidence B), this would mean that
- the position of the depths and dangers marked on this ENC may be inaccurate for about 50 meters
- There may be an error in the depths for up to 1 meter + 2% of depth
So if at any place the charted depth is showing 20 meters, the error in this could be 1.4 Meters (1 meters + 2% of 20 meters).
CATZOC information on paper charts
It is not that CATZOC has surfaced recently. It had been there since long.
On paper charts it was in form of something called “the source diagram”.
On each paper chart, there is a source diagram which tells the source of the information on the paper chart.
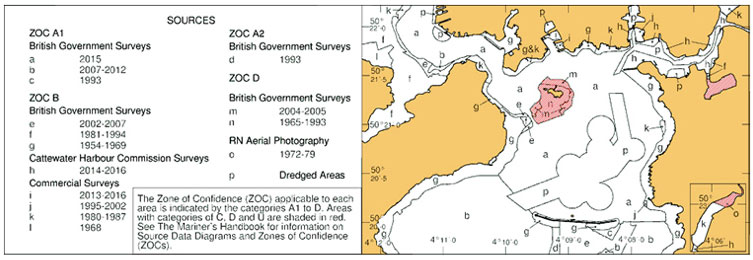
For example look at this source diagram of BA chart.
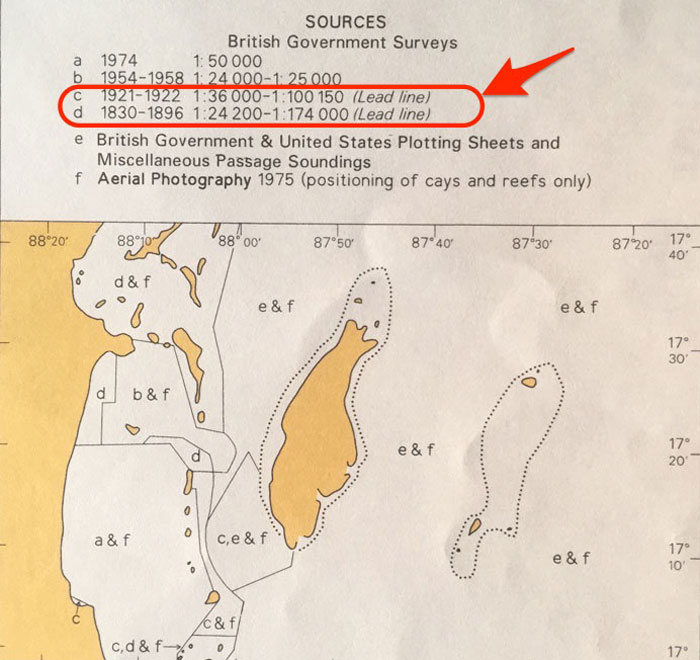
It has divided the areas based on the nature of survey done for this chart.
As you can see that in Area “c and d” depths were taken by a lead line. The depths in this area can be expected to have significant error.
Navigators need to apply this error to the depths. But again, How much error?
There is a sad news.
Paper charts never gave how much error these depths can have. It was left to the mariner to make the judgment about the information provided in the source diagram.
But then UKHO realized this and updated the source diagram on the new charts with CATZOC information.
Catzoc on ECDIS
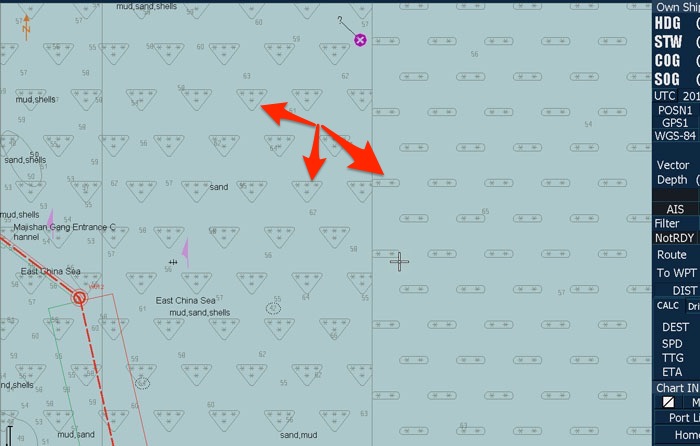
On ECDIS, the CATZOC information is displayed as CATZOC symbols.
These ECDIS symbols are in form of the number of stars.
Each symbol represents a particular “zone of confidence” category.
An ENC with six stars would mean that the information in this ENC is highly accurate. Let us see where to find this information on JRC ECDIS.
To find this information on JRC ECDIS, go to Chart -> Chart Settings
Then go to View 1. Under this ensure that option “Accuracy” is checked.
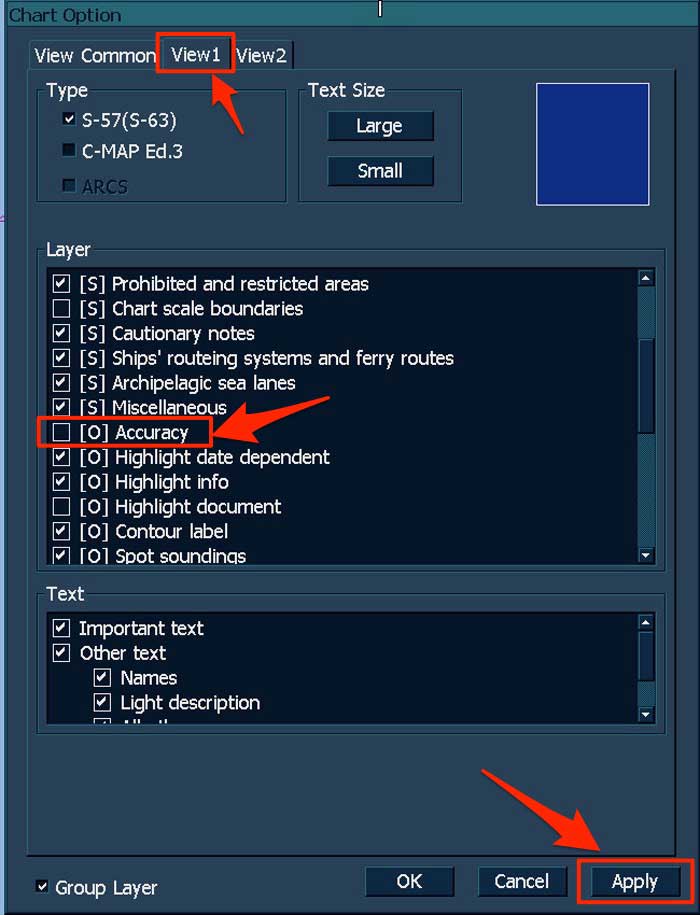
This will show the CATZOC symbol on all the ENCs on the ECDIS.
To get more information on the “zone of confidence” of a particular ENC, while the accuracy is still selected in the settings, right click on the ENC.
Then go to S-57/C-MAP/ARCS Information.
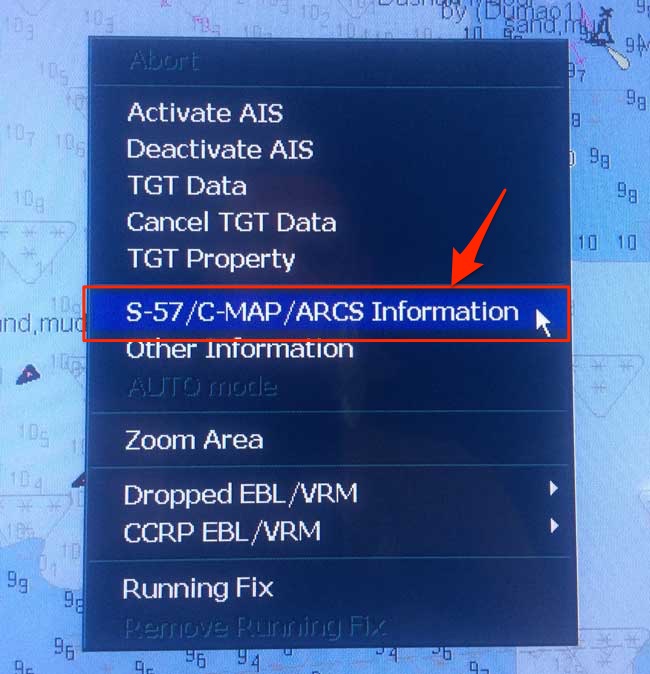
Click on the Quality of data and it will show the “Zone of Confidence” for that ENC.
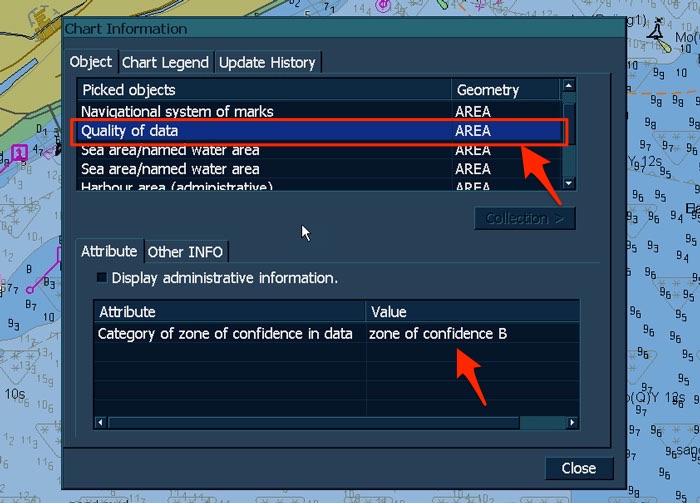
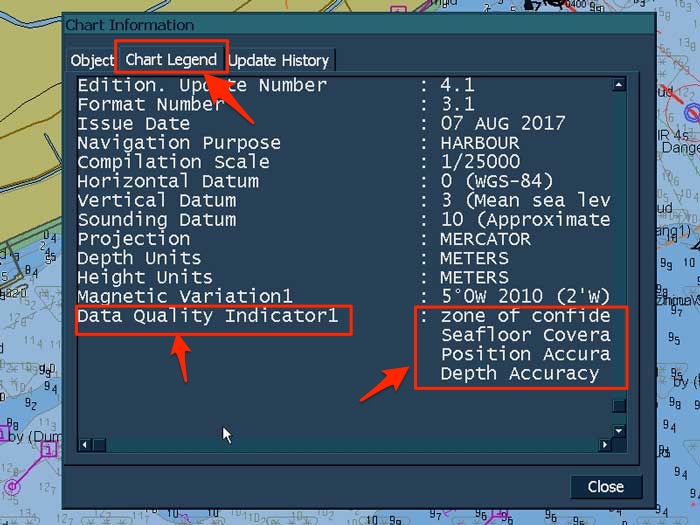
If you now go to “Chart Legend” tab, it will give you further information for that “Zone of confidence” like position accuracy and depth accuracy values.
How to use CATZOC Information
To use the CATZOC information, all we need to do is apply the maximum possible errors wherever required.
If we are planning a planning a passage that involves passing close to a danger, we need to keep safe distance considering the CATZOC category in that area.
Let us say we have planned a passage in an area with CATZOC category of 3 stars (zone of confidence “C”).
This is one part of our passage that passes from a known danger by 0.4 NM.
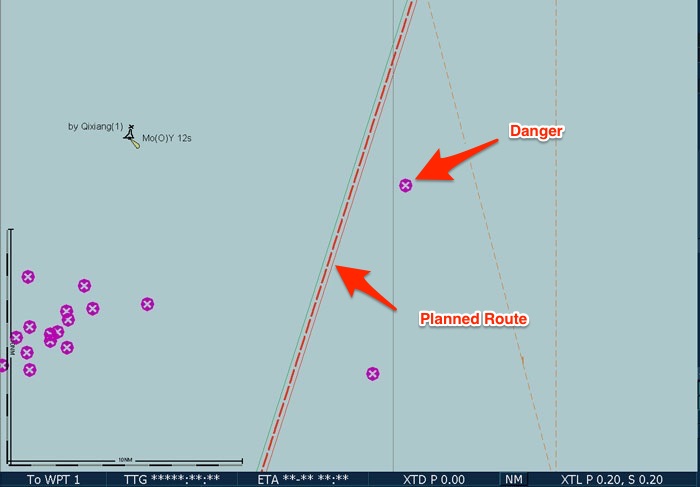
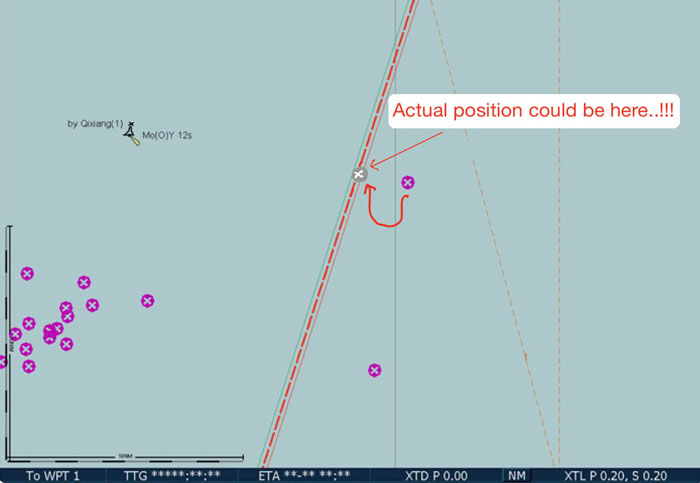
As the CATZOC category is 3 stars (zone of confidence “C”), there could be position error of up to 500 meters in showing the position of this danger.
500 Meters is approximately equal to 0.3 NM.
So even though we may be thinking that we are passing clear of the danger, the danger could be right on our course if we do not consider the CATZOC in that area.
Consideration for Depth accuracy
We also need to take the errors in depth in consideration because of CATZOC category of ENC.
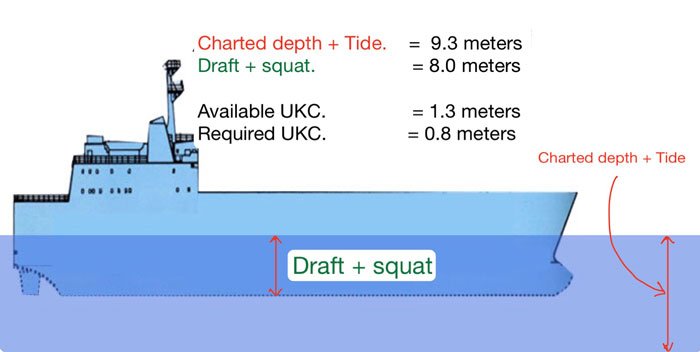
Let us say vessel need to pass through this area which has the least depth of 8.5 meters.
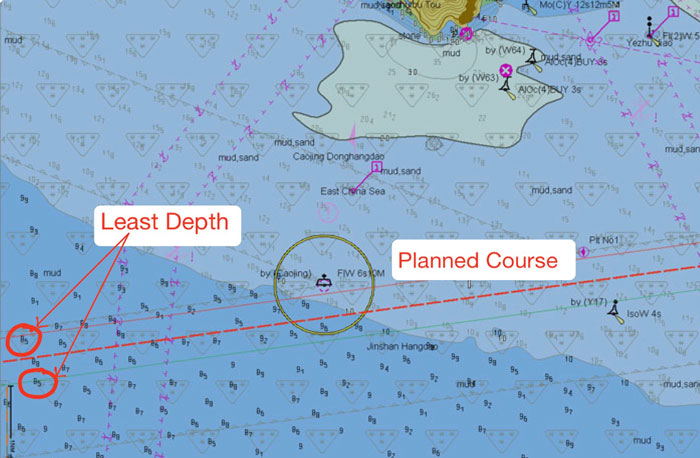
The minimum tide in this area is 0.9 meters. So available depth in this area is 9.3 Meters.
Vessel’s maximum draft is 7.2 meters.
Vessel expected to experience squat of 0.8 meters. The company requires the vessel to maintain UKC of 10% of the maximum draft (including squat).
A simple UKC calculation would depict that vessel will easily comply with the UKC policy of the company.
Everything looks OK except the fact that if the data in this ENC belongs to say 4 stars CATZOC (zone of confidence “B”), there can be an error in depths up to 1 meters + 0.2% of depth.
So in this case, the error in depths can be up to 1.17 meters (1 + 0.17 meters).
In this case, not only the vessel will not comply with company’s UKC policy, there are great chances of the vessel running aground.
UKC Calculation on board needs to take CATZOC information in the account.
When we take CATZOC into account for the depth of 8.45meters and 4-star CATZOC (zone of confidence “B”), we need to assume the maximum error in this depth.
So we need to assume that the minimum depth in this area is 7.33 meters only, 1.17 meters being the error in-depth reading.
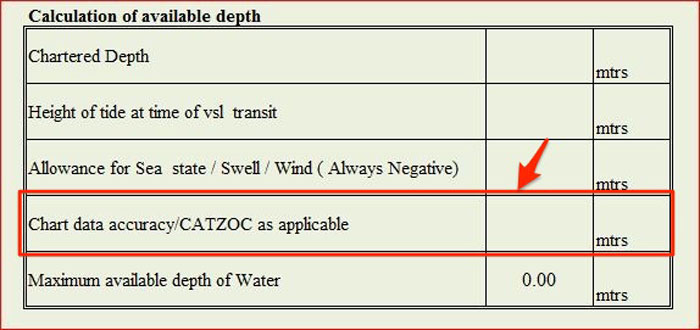
Even the company’s UKC calculation form need to have CATZOC depth error.
Dynamic Under Keel Clearance Assessment.

This is the safest way to calculate the UKC:
Considering the dynamic draft.
Possible changes to the seabed.
Possible errors in draft observations as well as data collection from ENC's are possible.
ECDIS has safety setting feature in it. These safety settings includefor Safety Depth on ECDIS
- Safety depth
- Safety Contour
- Shallow contour
- Deep water contour
So now let us say your draft is 8 meters and expected Squat is 1 meter. That means vessel has an effective draft of 9 meters.Safety depth is the minimum depth at which the vessel would comply with the company’s UKC policy.
The company requires the vessel to maintain UKC of 10% of the draft. In this case, it would be 0.9 meters.
So the required depth to comply with company’s UKC policy would be 9.9 meters.
In this case, the safety depth would be 9.9 meters but without considering the CATZOC.
If we enter the value as it, the ECDIS will show 10 meters depth as safe depth for the vessel.
But 10 meters depth may have an error of 1.2 meters (CATZOC 4 stars) and the actual depth could be 8.8 meters only.
So when entering safety depth value in ECDIS, we need to consider the CATZOC in that area and enter the corrected value for safety depth in the ECDIS.
In the example above, if we allow the CATZOC error in depth for “zone of confidence B”, the minimum depth for complying with the company’s UKC policy will be 11.25 meters.
Since ECDIS does not take decimal values for the safety depth, in this case, we can enter 12 meters as the safety depth setting.
Conclusion
The data shown on the nautical charts and ENCs may have errors depending upon how this data was measured and when it was measured.
Older the data, the less accurate it will be because of old technology used for measuring the data.
The level of accuracy has been divided into six categories known as “zone of confidence” or CATZOC.
Each “zone of confidence” (CATZOC) has been assigned a maximum error value for the depths and its position shown on the charts.
While planning the passage, it is important that these errors are taken into account.
It becomes more important to allow for the CATZOC when calculating the UKC in shallow waters or when passing close to a danger marked on the chart.
source [https://www.myseatime.com]
Comments